在tensorflow 中使用1D CNN结合加速度数据实现活动识别
本文介绍如何使用1Dcnn 对时间序列的加速度计信号进行处理,并训练和识别出站立,坐,步行,慢跑等动作,使用tensorflow 的环境和python进行开发。
环境:
ubuntu
pip list 指令可以查看版本如下,使用python2 ,pip install tensorflow 安装1.14的版本。
Keras (2.2.5)
Keras-Applications (1.0.8)
Keras-Preprocessing (1.1.2)
keyring (10.6.0)
keyrings.alt (3.0)
kiwisolver (1.1.0)
Markdown (3.1.1)
matplotlib (2.2.5)
mock (3.0.5)
numpy (1.16.6)
openpyxl (2.6.4)
pandas (0.24.2)
Pillow (6.2.2)
pip (9.0.1)
protobuf (3.17.0)
pycrypto (2.6.1)
pydicom (1.4.2)
Pygments (2.2.0)
pygobject (3.26.1)
pyparsing (2.4.7)
pystackreg (0.2.2)
python-dateutil (2.8.1)
pytz (2021.1)
pyxdg (0.25)
PyYAML (5.4.1)
scikit-learn (0.20.4)
scipy (1.2.3)
SecretStorage (2.3.1)
setuptools (44.1.1)
Shapely (1.7.1)
six (1.16.0)
sklearn (0.0)
subprocess32 (3.5.4)
tensorboard (1.14.0)
tensorflow (1.14.0)
tensorflow-estimator (1.14.0)
本文包含:
数据集和预处理;
CNN模型
- 数据集预处理
数据的采集来源于智能手机的陀螺仪加速度计,加速度包含x,y,z三轴的数据,该数据集包含在受控实验室环境中收集的六项日常活动。这些活动包括慢跑,散步,上楼梯,下楼梯,坐着和站着。数据是从36位用户的口袋中使用智能手机以20Hz采样率(每秒20个值)收集的。下图显示了有关活动(类标签)的数据集分布。目前现成的数据来源于actitracker ,链接 https://www.cis.fordham.edu/wisdm/dataset.php#actitracker
-
Files:
- readme.txt
- WISDM_ar_v1.1_raw_about.txt
- WISDM_ar_v1.1_trans_about.txt
- WISDM_ar_v1.1_raw.txt
- WISDM_ar_v1.1_transformed.arff
- WISDM_ar_v1.1_raw_about.txt
为原始的 数据,如下图,已经给设计好,第一列为用户ID ,然后为活动类型,分别是x,y,z的数据,这里我将下载的数据进行了处理,去掉了最后一行的 ;。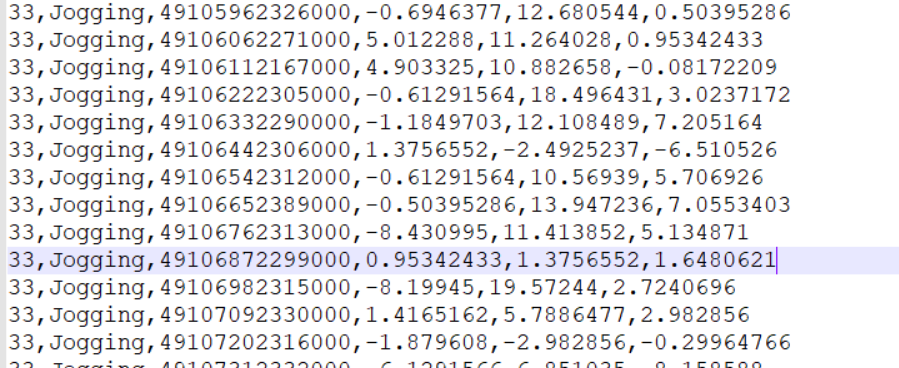
数据预处理的目的是将数据从文本中提取出来并进行编排,和归一化,这里的加速度有三个信号量,分别是,x轴,y轴z轴,这些分量要进行归一化feature_normalize,以方便制定一个规范和标准。
def feature_normalize(dataset):
    mu = np.mean(dataset,axis = 0)
    sigma = np.std(dataset,axis = 0)
    return (dataset - mu)/sigma
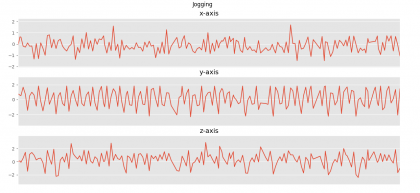
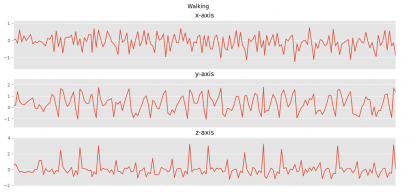
通过plot 可以查看数据的图视,
for activity in np.unique(dataset["activity"]):
    subset = dataset[dataset["activity"] == activity][:180]
    plot_activity(activity,subset)
这部分的源码 下边。
activityShow.py
# -*- coding:utf-8 -*-
import pandas as pd
import numpy as np
import matplotlib.pyplot as plt
from scipy import stats
import tensorflow as tf

#%matplotlib inline
plt.style.use('ggplot')

def read_data(file_path):
    column_names = ['user-id','activity','timestamp', 'x-axis', 'y-axis', 'z-axis']
    data = pd.read_csv(file_path,header = None, names = column_names)
    return data

def feature_normalize(dataset):
    mu = np.mean(dataset,axis = 0)
    sigma = np.std(dataset,axis = 0)
    return (dataset - mu)/sigma

def plot_axis(ax, x, y, title):
    ax.plot(x, y)
    ax.set_title(title)
    ax.xaxis.set_visible(False)
    ax.set_ylim([min(y) - np.std(y), max(y) + np.std(y)])
    ax.set_xlim([min(x), max(x)])
    ax.grid(True)

def plot_activity(activity,data):
    fig, (ax0, ax1, ax2) = plt.subplots(nrows = 3, figsize = (15, 10), sharex = True)
    plot_axis(ax0, data['timestamp'], data['x-axis'], 'x-axis')
    plot_axis(ax1, data['timestamp'], data['y-axis'], 'y-axis')
    plot_axis(ax2, data['timestamp'], data['z-axis'], 'z-axis')
    plt.subplots_adjust(hspace=0.2)
    fig.suptitle(activity)
    plt.subplots_adjust(top=0.90)
    plt.show()

dataset = read_data('actitracker_raw.txt')
dataset.dropna(axis=0, how='any', inplace= True)
dataset['x-axis'] = feature_normalize(dataset['x-axis'])
dataset['y-axis'] = feature_normalize(dataset['y-axis'])
dataset['z-axis'] = feature_normalize(dataset['z-axis'])
for activity in np.unique(dataset["activity"]):
    subset = dataset[dataset["activity"] == activity][:180]
    plot_activity(activity,subset)
如下,截取了两张效果图,下面的代码将绘制每个人类活动的9秒信号,我们可以在下图中看到。通过对图形的视觉检查,我们可以确定不同活动中信号各轴的差异。
我们预处理数据的最终目的是 CNN能够认知的数据格式。输入格式为[总片段,,输入高度,输入宽度和输入通道],这里数据是1D,
所以输入的数据高度为1 ,宽度根据自己设定。本文中论文作者,提出的窗口宽度为90.所以 输入宽度为90,输入通道为xyz ,3.
标签使用 get_dummies 函数 Pandas软件包中提供的功能进行热编码。
def windows(data, size):
    start = 0
    while start < data.count():
        yield int(start), int(start + size)
        start += (size / 2)

def segment_signal(data,window_size = 90):
    segments = np.empty((0,window_size,3))
    labels = np.empty((0))
    for (start, end) in windows(data["timestamp"], window_size):
        x = data["x-axis"][start:end]
        y = data["y-axis"][start:end]
        z = data["z-axis"][start:end]
        if(len(dataset["timestamp"][start:end]) == window_size):
            segments = np.vstack([segments,np.dstack([x,y,z])])
            labels = np.append(labels,stats.mode(data["activity"][start:end])[0][0])
    return segments, labels
segments, labels = segment_signal(dataset)
labels = np.asarray(pd.get_dummies(labels), dtype = np.int8)
reshaped_segments = segments.reshape(len(segments), 1,90, 3)
现在我们有了所需格式的数据集,让我们将其随机分为训练和测试集(70/30)。
下图提供了我们将使用Tensorflow实现的CNN模型架构。如果您对Keras或其他任何深度学习框架感到满意,请随时使用。该模型将由一个卷积层,最大池和另一个卷积层组成。之后,模型将具有一个完全连接的层,该层连接到Softmax层。 卷积层和最大池层将是一维的。
train_test_split = np.random.rand(len(reshaped_segments)) < 0.70
train_x = reshaped_segments[train_test_split]
train_y = labels[train_test_split]
test_x = reshaped_segments[~train_test_split]
test_y = labels[~train_test_split]
CNN模型
。第一卷积层的过滤器大小和深度为60(卷积层的输出将获得的通道数)。池化层的过滤器大小设置为20,跨度为2。接下来,卷积层接受最大池化层的输入以应用尺寸为6的过滤器,并且深度为最大池化的十分之一层。此后,将为完全连接的图层输入平整输出。如上述配置所定义,在完全连接的层中有1000个神经元。tanh函数在该层中用作非线性。最后,Softmax层被定义为输出类标签的概率。
编写损失函数,梯度优化器,预测和准确率。
loss = -tf.reduce_sum(Y * tf.log(y_))
optimizer = tf.train.GradientDescentOptimizer(learning_rate = learning_rate).minimize(loss)

correct_prediction = tf.equal(tf.argmax(y_,1), tf.argmax(Y,1))
accuracy = tf.reduce_mean(tf.cast(correct_prediction, tf.float32))
此时我们拥有CNN的所有准备工作,然后开始编写训练。我们的参数是 高度1 宽度90 标签为6 的3通道数据,迭代5次。卷积核为60.训练过程中打印出模型的损失和准确性。训练结束时,模型将对测试集实例进行分类并打印出准确性。
with tf.Session() as session:
    tf.global_variables_initializer().run()
    for epoch in range(training_epochs):
        cost_history = np.empty(shape=[1],dtype=float)
        for b in range(total_batchs):
            offset = (b * batch_size) % (train_y.shape[0] - batch_size)
            batch_x = train_x[offset:(offset + batch_size), :, :, :]
            batch_y = train_y[offset:(offset + batch_size), :]
            _, c = session.run([optimizer, loss],feed_dict={X: batch_x, Y : batch_y})
            cost_history = np.append(cost_history,c)
        print "Epoch: ",epoch," Training Loss: ",np.mean(cost_history)," Training Accuracy: ",session.run(accuracy, feed_dict={X: train_x, Y: train_y})

    print "Testing Accuracy:", session.run(accuracy, feed_dict={X: test_x, Y: test_y})
我自己整理的 train.py
# -*- coding:utf-8 -*-
import pandas as pd
import numpy as np
import matplotlib.pyplot as plt
from scipy import stats
#import tensorflow as tf
import tensorflow.compat.v1 as tf
tf.disable_v2_behavior()
#%matplotlib inline
plt.style.use('ggplot')

def read_data(file_path):
    column_names = ['user-id','activity','timestamp', 'x-axis', 'y-axis', 'z-axis']
    data = pd.read_csv(file_path,header = None, names = column_names)
    return data

def feature_normalize(dataset):
    mu = np.mean(dataset,axis = 0)
    sigma = np.std(dataset,axis = 0)
    return (dataset - mu)/sigma

def plot_axis(ax, x, y, title):
    ax.plot(x, y)
    ax.set_title(title)
    ax.xaxis.set_visible(False)
    ax.set_ylim([min(y) - np.std(y), max(y) + np.std(y)])
    ax.set_xlim([min(x), max(x)])
    ax.grid(True)

def plot_activity(activity,data):
    fig, (ax0, ax1, ax2) = plt.subplots(nrows = 3, figsize = (15, 10), sharex = True)
    plot_axis(ax0, data['timestamp'], data['x-axis'], 'x-axis')
    plot_axis(ax1, data['timestamp'], data['y-axis'], 'y-axis')
    plot_axis(ax2, data['timestamp'], data['z-axis'], 'z-axis')
    plt.subplots_adjust(hspace=0.2)
    fig.suptitle(activity)
    plt.subplots_adjust(top=0.90)
    plt.show()

dataset = read_data('actitracker_raw.txt')
dataset.dropna(axis=0, how='any', inplace= True)
dataset['x-axis'] = feature_normalize(dataset['x-axis'])
dataset['y-axis'] = feature_normalize(dataset['y-axis'])
dataset['z-axis'] = feature_normalize(dataset['z-axis'])
#for activity in np.unique(dataset["activity"]):
#    subset = dataset[dataset["activity"] == activity][:180]
#    plot_activity(activity,subset)

def windows(data, size):
    start = 0
    while start < data.count():
        yield int(start), int(start + size)
        start += (size / 2)

def segment_signal(data,window_size = 90):
    segments = np.empty((0,window_size,3))
    labels = np.empty((0))
    for (start, end) in windows(data["timestamp"], window_size):
        x = data["x-axis"][start:end]
        y = data["y-axis"][start:end]
        z = data["z-axis"][start:end]
        if(len(dataset["timestamp"][start:end]) == window_size):
            segments = np.vstack([segments,np.dstack([x,y,z])])
            labels = np.append(labels,stats.mode(data["activity"][start:end])[0][0])
    return segments, labels
segments, labels = segment_signal(dataset)
labels = np.asarray(pd.get_dummies(labels), dtype = np.int8)
reshaped_segments = segments.reshape(len(segments), 1,90, 3)
train_test_split = np.random.rand(len(reshaped_segments)) < 0.70
train_x = reshaped_segments[train_test_split]
train_y = labels[train_test_split]
test_x = reshaped_segments[~train_test_split]
test_y = labels[~train_test_split]

input_height = 1
input_width = 90
num_labels = 6
num_channels = 3

batch_size = 10
kernel_size = 60
depth = 60
num_hidden = 1000

learning_rate = 0.0001
training_epochs = 5

total_batchs = train_x.shape[0] #batch_size

def weight_variable(shape):
    initial = tf.truncated_normal(shape, stddev = 0.1)
    return tf.Variable(initial)

def bias_variable(shape):
    initial = tf.constant(0.0, shape = shape)
    return tf.Variable(initial)

def depthwise_conv2d(x, W):
    return tf.nn.depthwise_conv2d(x,W, [1, 1, 1, 1], padding='VALID')

def apply_depthwise_conv(x,kernel_size,num_channels,depth):
    weights = weight_variable([1, kernel_size, num_channels, depth])
    biases = bias_variable([depth * num_channels])
    return tf.nn.relu(tf.add(depthwise_conv2d(x, weights),biases))

def apply_max_pool(x,kernel_size,stride_size):
    return tf.nn.max_pool(x, ksize=[1, 1, kernel_size, 1],
                          strides=[1, 1, stride_size, 1], padding='VALID')

X = tf.placeholder(tf.float32, shape=[None,input_height,input_width,num_channels])
Y = tf.placeholder(tf.float32, shape=[None,num_labels])

c = apply_depthwise_conv(X,kernel_size,num_channels,depth)
p = apply_max_pool(c,20,2)
c = apply_depthwise_conv(p,6,depth*num_channels,depth//10)

shape = c.get_shape().as_list()
c_flat = tf.reshape(c, [-1, shape[1] * shape[2] * shape[3]])

f_weights_l1 = weight_variable([shape[1] * shape[2] * depth * num_channels * (depth//10), num_hidden])
f_biases_l1 = bias_variable([num_hidden])
f = tf.nn.tanh(tf.add(tf.matmul(c_flat, f_weights_l1),f_biases_l1))

out_weights = weight_variable([num_hidden, num_labels])
out_biases = bias_variable([num_labels])
y_ = tf.nn.softmax(tf.matmul(f, out_weights) + out_biases)
loss = -tf.reduce_sum(Y * tf.log(y_))
optimizer = tf.train.GradientDescentOptimizer(learning_rate = learning_rate).minimize(loss)

correct_prediction = tf.equal(tf.argmax(y_,1), tf.argmax(Y,1))
accuracy = tf.reduce_mean(tf.cast(correct_prediction, tf.float32))
with tf.Session() as session:
    tf.global_variables_initializer().run()
    for epoch in range(training_epochs):
        cost_history = np.empty(shape=[1],dtype=float)
        for b in range(total_batchs):
            offset = (b * batch_size) % (train_y.shape[0] - batch_size)
            batch_x = train_x[offset:(offset + batch_size), :, :, :]
            batch_y = train_y[offset:(offset + batch_size), :]
            _, c = session.run([optimizer, loss],feed_dict={X: batch_x, Y : batch_y})
            cost_history = np.append(cost_history,c)
        print "Epoch: ",epoch," Training Loss: ",np.mean(cost_history)," Training Accuracy: ",session.run(accuracy, feed_dict={X: train_x, Y: train_y})

    print "Testing Accuracy:", session.run(accuracy, feed_dict={X: test_x, Y: test_y})
2021-05-25 11:50:40.302744: W tensorflow/core/framework/allocator.cc:107] Allocation of 381069360 exceeds 10% of system memory.
Epoch: 0 Training Loss: 3.8517332207302077 Training Accuracy: 0.8977333
2021-05-25 11:53:01.942231: W tensorflow/core/framework/allocator.cc:107] Allocation of 381069360 exceeds 10% of system memory.
Epoch: 1 Training Loss: 5.998888750312241 Training Accuracy: 0.9045276
2021-05-25 11:55:24.059934: W tensorflow/core/framework/allocator.cc:107] Allocation of 381069360 exceeds 10% of system memory.
Epoch: 2 Training Loss: 7.68694544115031 Training Accuracy: 0.90241903
2021-05-25 11:57:45.170686: W tensorflow/core/framework/allocator.cc:107] Allocation of 381069360 exceeds 10% of system memory.
Epoch: 3 Training Loss: 9.099948755667507 Training Accuracy: 0.9047619
2021-05-25 12:00:05.481399: W tensorflow/core/framework/allocator.cc:107] Allocation of 381069360 exceeds 10% of system memory.
Epoch: 4 Training Loss: 10.314491962828486 Training Accuracy: 0.90909624
Testing Accuracy: 0.89004093
原文:https://aqibsaeed.github.io/2016-11-04-human-activity-recognition-cnn/
GitHub :https://github.com/aqibsaeed/Human-Activity-Recognition-using-CNN

